
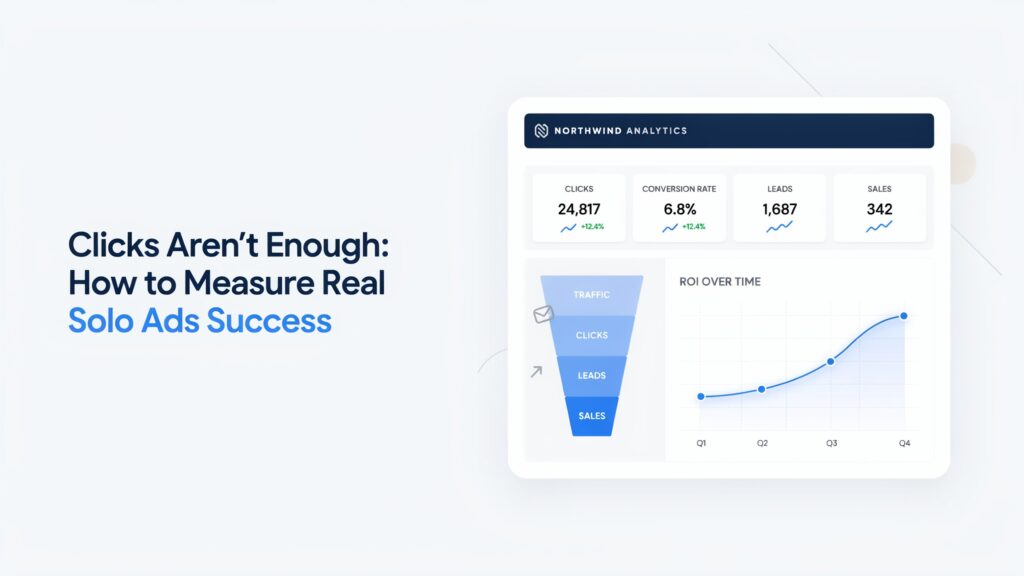
Getting a high number of clicks from a solo ad can feel like a win. But clicks alone do not tell you whether your campaign is actually producing business results. A traffic source can generate hundreds of visitors while delivering very few leads, customers, or sales.
True solo ads success comes from understanding what happens after someone clicks your link. Are visitors joining your email list? Are they engaging with your offer? Do they eventually purchase? And most importantly, are you generating more revenue than you spend?
In this guide, we will look beyond basic click numbers and explore the metrics that can help you determine whether your solo ad campaigns are genuinely profitable.
Table of Contents
Start With the Difference Between Clicks and Results
Clicks are one of the easiest solo ad metrics to track, which is why marketers often focus on them. However, a click simply means someone visited your landing page. It does not guarantee interest, engagement, or a purchase.
Imagine you purchase a solo ad that generates 500 clicks. At first glance, that sounds impressive. But suppose only 20 people subscribe to your email list and just one person eventually buys your product. The traffic volume looks strong, but the campaign may not be financially successful.
This is why solo ads success should be measured using the entire customer journey rather than a single traffic metric.
Consider these stages:
Ad → Click → Landing Page → Lead → Email Engagement → Sale → Revenue
Every stage provides useful information.
For example, if you receive 500 clicks but only 10 leads, your landing page may have a conversion problem. If you generate 100 leads but no sales, your follow-up sequence or offer may need improvement.
The goal is not simply to get more visitors. The goal is to turn relevant visitors into measurable business outcomes.
Measure Solo Ads Success With Conversion Rate
Your conversion rate tells you how effectively your traffic performs a desired action. That action could be submitting a form, joining your email list, downloading a resource, booking a call, or purchasing a product.
A simple conversion-rate formula is:
Conversion Rate = Conversions ÷ Visitors × 100
For example:
- 500 visitors
- 75 email subscribers
- Conversion rate = 15%
That number provides much more insight than the original 500-click figure.
Suppose another campaign produces only 300 visitors but generates 90 subscribers. Its conversion rate is 30%. Although the second campaign received fewer clicks, it produced more leads and may represent stronger solo ads success.
You can also compare conversion rates between different landing pages.
For instance:
Landing Page A:
500 visitors → 50 leads = 10%
Landing Page B:
500 visitors → 100 leads = 20%
The second page is converting twice as many visitors. Instead of immediately buying more traffic, you could improve your campaign by identifying what makes the stronger page work.
Test elements such as:
- Headline
- Call-to-action
- Form length
- Offer
- Page layout
- Social proof
- Benefits
- Trust signals
A better conversion rate means you can potentially generate more leads from the same traffic budget.
Track Solo Ads Success Through Lead Quality
Not every lead has the same value.
A campaign might generate hundreds of subscribers, but if those subscribers never open your emails, click your offers, or make purchases, the apparent performance can be misleading.
This is where lead quality becomes important.
Suppose two solo ad campaigns generate the following results:
| Metric | Campaign A | Campaign B |
|---|---|---|
| Clicks | 1,000 | 600 |
| Leads | 200 | 100 |
| Email Opens | 40% | 65% |
| Sales | 5 | 15 |
| Revenue | $500 | $1,500 |
Campaign A generated twice as many leads, but Campaign B produced three times the revenue.
That tells you something important about solo ads success: volume does not automatically equal value.
To evaluate lead quality, monitor:
- Email open rates
- Email click-through rates
- Replies
- Webinar registrations
- Trial activations
- Product purchases
- Repeat purchases
- Unsubscribes
- Engagement over time
You should also examine where your best customers came from.
If one solo ad vendor consistently sends people who become paying customers while another sends people who rarely engage, the first vendor may be far more valuable—even if their traffic costs more.
Look Beyond the First Conversion
One common mistake is judging a campaign immediately after someone joins your list.
A new subscriber may not purchase on day one. They might need several emails, additional education, demonstrations, testimonials, or reminders before becoming a customer.
This means your measurement window should match your sales cycle.
For example, imagine you spend $300 on traffic and initially generate $150 in sales. It may appear that the campaign lost money.
However, over the next 30 days, those subscribers generate another $400 in purchases.
Your total revenue becomes:
$150 + $400 = $550
That changes the performance calculation significantly.
This is why solo ads success should be evaluated over an appropriate period rather than based only on immediate sales.
Depending on your business, consider tracking performance after:
- 24 hours
- 7 days
- 14 days
- 30 days
- 60 days
The right period depends on your offer and customer journey.
A low-ticket product might convert quickly, while a higher-priced service may require weeks of follow-up.
Calculate Cost Per Lead and Customer Acquisition Cost
Revenue is important, but you also need to understand how much you’re spending to generate each lead and customer.
Cost Per Lead
The formula is:
Cost Per Lead = Advertising Cost ÷ Number of Leads
For example:
You spend $250 and generate 100 leads.
$250 ÷ 100 = $2.50 per lead
Now compare that with another campaign:
You spend $300 and generate 75 leads.
$300 ÷ 75 = $4 per lead
The first campaign has the lower cost per lead.
However, don’t automatically choose it.
If the $4 leads convert into customers at a much higher rate, they may actually be more profitable.
Customer Acquisition Cost
Customer Acquisition Cost, or CAC, looks deeper.
CAC = Total Marketing Cost ÷ Number of New Customers
Suppose you spend $500 and acquire 20 customers.
$500 ÷ 20 = $25 CAC
If each customer generates $75 in profit, the campaign may be attractive.
If each customer generates only $15, you have a problem.
This is why solo ads success requires connecting traffic costs with actual customer economics.
Use ROI to Determine Solo Ads Success
Return on investment is one of the clearest ways to evaluate whether your campaign is financially worthwhile.
A basic ROI formula is:
ROI = (Revenue − Cost) ÷ Cost × 100
For example, suppose:
- Solo ad cost = $400
- Revenue generated = $800
Your calculation would be:
($800 − $400) ÷ $400 × 100 = 100% ROI
You doubled your original advertising spend in revenue.
However, remember that revenue and profit are not the same thing. If your product has fulfillment costs, transaction fees, commissions, or other expenses, your true profit may be lower.
For example:
- Ad spend = $400
- Revenue = $800
- Product and fulfillment costs = $200
- Net profit before other overhead = $200
The campaign may still be profitable, but the economics are different from simply saying you generated $800 from $400.
For accurate solo ads success measurement, track both revenue and profit whenever possible.
You can also compare campaigns using metrics such as:
- ROI
- ROAS
- CAC
- Revenue per subscriber
- Customer lifetime value
- Profit per customer
These numbers help you identify which campaigns deserve additional investment.
Analyze the Full Funnel Before Scaling
Before buying more traffic, look at your entire funnel.
A strong solo ad campaign usually involves multiple connected components:
Traffic Source → Landing Page → Lead Capture → Follow-Up → Offer → Purchase
If one stage performs poorly, increasing traffic may simply increase your losses.
For example:
You receive 1,000 visitors.
Your landing page converts 20%:
1,000 × 20% = 200 leads
Your sales funnel converts 5% of those leads:
200 × 5% = 10 customers
Now imagine you improve the landing-page conversion rate from 20% to 30%.
The same 1,000 visitors produce:
1,000 × 30% = 300 leads
At the same 5% sales conversion rate:
300 × 5% = 15 customers
You generated 50% more customers without purchasing additional traffic.
This demonstrates why solo ads success is not only about finding more clicks. It is also about improving the system that handles those clicks.
Before scaling, review:
- Traffic relevance
- Click-through rate
- Landing-page conversion
- Lead quality
- Email engagement
- Sales conversion
- Average order value
- Customer lifetime value
- Refund rate
- Overall profit
When these numbers work together, scaling becomes much more predictable.
Conclusion
Clicks are useful, but they are only the beginning of the measurement process. A large click count can look impressive while hiding weak conversions, poor lead quality, low engagement, or unprofitable customer acquisition costs.
Real solo ads success comes from tracking the complete journey from visitor to lead to customer and, ultimately, revenue and profit.
Start by measuring conversion rate, lead quality, cost per lead, customer acquisition cost, sales, ROI, and long-term customer value. Then use those numbers to identify weak points in your funnel.
The best solo ad campaign is not necessarily the one that produces the most clicks. It is the one that consistently turns relevant traffic into valuable customers at a profitable cost. 📈
Frequently Asked Questions?
What is the most important metric to track?
There is no single metric that works for every business. Conversion rate, customer acquisition cost, revenue, and profit are generally more useful for evaluating overall campaign performance than traffic volume alone.
How many clicks should a campaign generate?
There is no universal number. The ideal click volume depends on your budget, audience, offer, landing page, and conversion rate. Focus on the quality and outcome of the visitors rather than chasing a specific click count.
How long should I wait before evaluating a campaign?
Give your campaign enough time to account for your sales cycle. Some offers convert within days, while others may require several weeks of email follow-up.
What is a good conversion rate for a landing page?
A good rate varies considerably by industry, audience, offer, traffic source, and page quality. Instead of relying on a universal benchmark, establish your current conversion rate and work toward consistent improvements.
Should I focus on leads or sales?
You should track both. Leads show whether your traffic and landing page are working, while sales reveal whether those leads are ultimately generating revenue.